Blogpost: Storytelling, with something better than a pie chart
This group, Data 4 Climate Action Edinburgh, is about learning and sharing skills as much as anything else. That’s what’s behind our latest creation - a simple data visualisation. But one that tells a story. I will go back to the beginning…
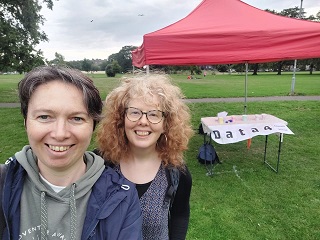
The Edinburgh Climate Festival of 2022 was an excellent event. We held a stall there (with thanks to Jennifer and Tracy for their essential help, and thanks to University of Edinburgh for the gazebo), to ask people how they’d like us to direct our energies. We invited attendees to cast their votes for one or more different data-related activities, our potential areas of work, by popping casino chips into labelled paper cups representing several different categories. I counted the chips. The story of the day was that the most popular activity by far was ‘storytelling with data’.
I made a table in Excel, produced a pie chart and popped it on the facebook page. Small data.
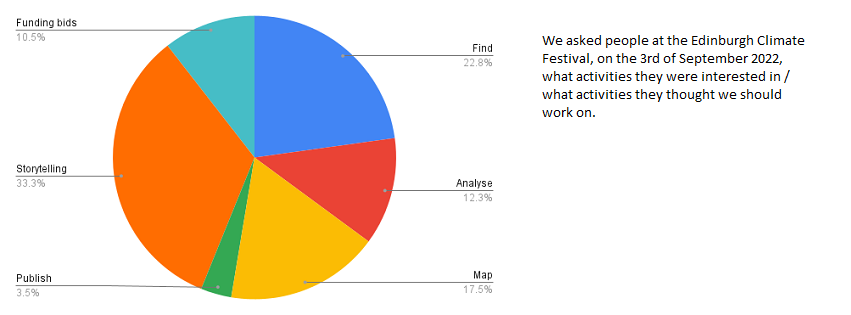
Then I discovered the “Storytelling with data” blog and book by Cole Nussbaumer Knaflic. www.storytellingwithdata.com . Turns out, pie charts are not ideal for visualising comparisons of this kind, because the human brain finds it a little challenging to compare the respective sizes of the slices of the pie. Far better to plot bars, ordered by size, with the highest at the top, much clearer! Even small data deserves good storytelling. So I used Tableau Public, a free data visualisation tool for open datasets, to produce a bar chart:
Small data deserves good stewardship too. Applying some of the modern open research tools would make the data more findable, accessible, interoperable and reusable. So I expanded the materials already openly available on our GitHub repo to incorporate a CSV version of the data, for interoperability. And a readme file for reusability. The element that was still missing was a persistent unique identifier. So I used GitHub’s integration with Zenodo to archive a release of the repo:
data4climateactionedinburgh. (2023). Data-4-Climate-Action-Edinburgh/Data4ClimateActionEdinburgh_Code_etc: Data from 2022 survey (data). Zenodo. https://doi.org/10.5281/zenodo.8030084
If you’re part of a climate group in Edinburgh and you’d like some support with any data-related tasks, please do get in touch, no data too small!
Pauline Ward