Methods - ABCD Report 2025
Methods Section
As a citizen science group, this Methods document is written for a citizen scientist audience, to share learning about working with climate data.
Data visualisations for this report have been produced using online tools and coding in R and Excel.
Temperature
Some key figures about predicted change came from the Met Office website LACE and LCAT tools, where the user can specify Edinburgh (and/or Scotland) and the tool generates a detailed report with stats for that area.
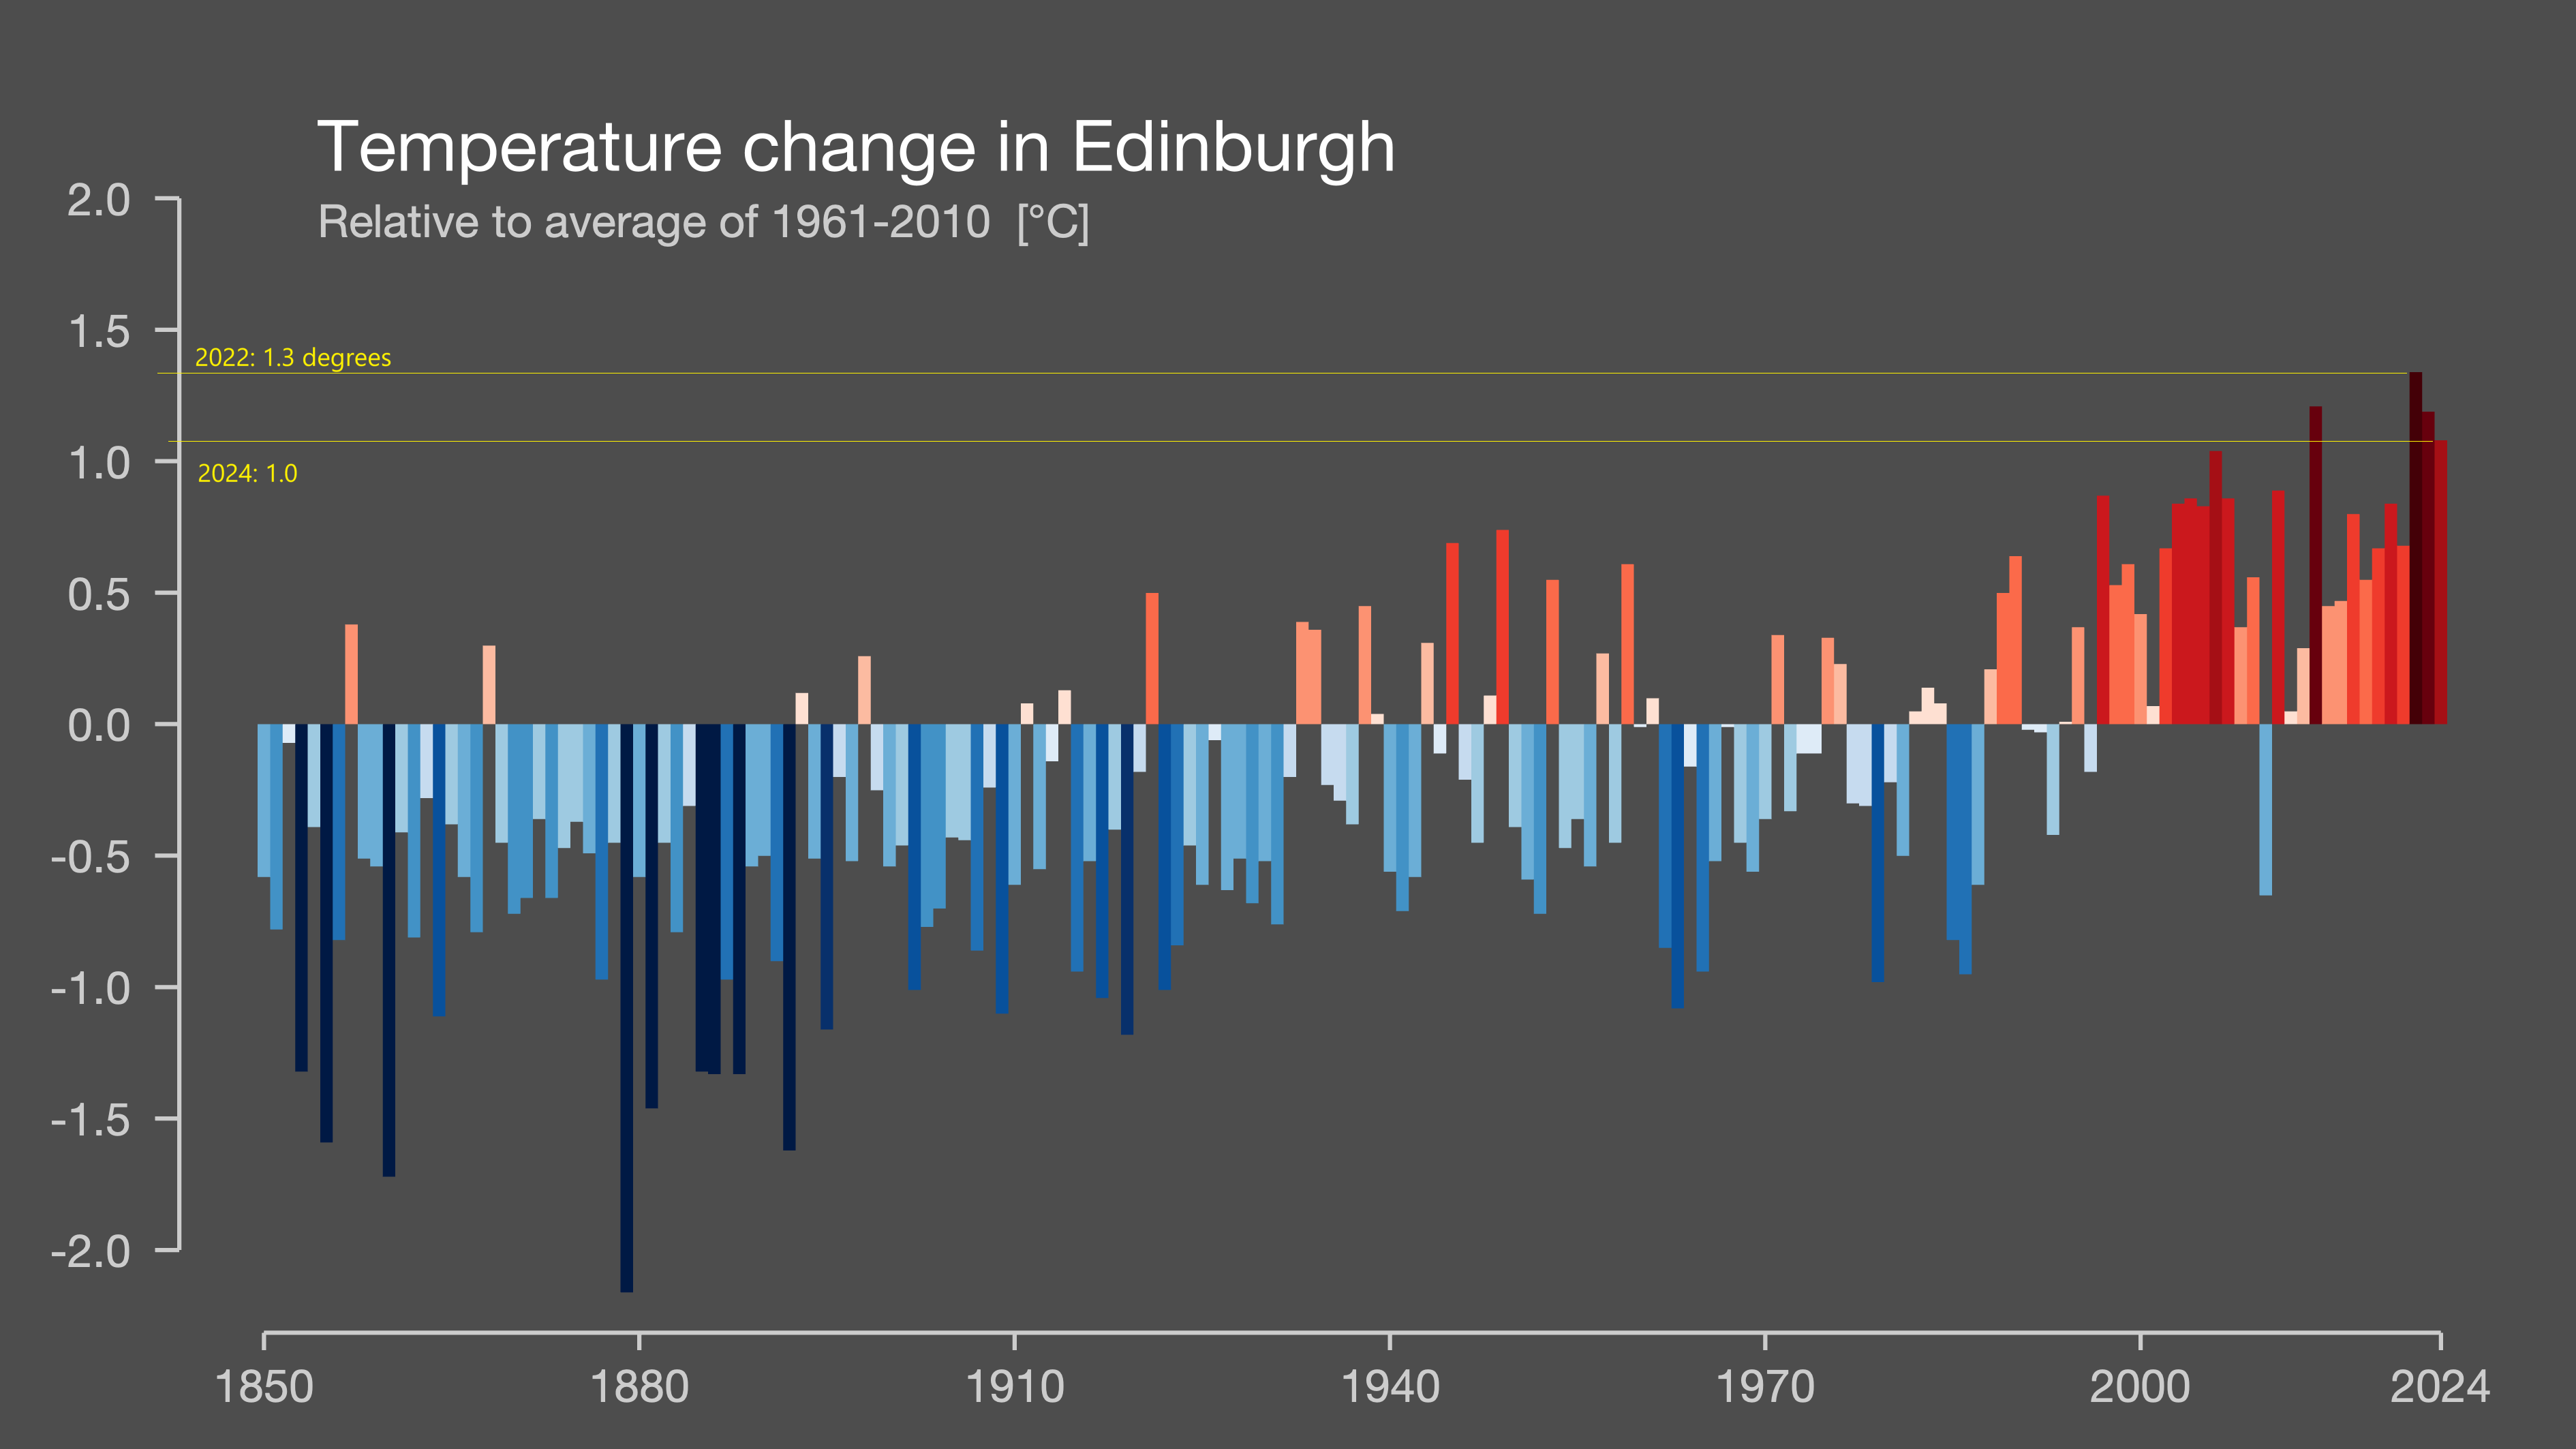
Drew two lines onto the temperature bar chart to read the axis.
We did attempt to extract temperature data from the CEDA archive. While it’s great that the data is made available, under an open licence, the request form gave the impression that only professional academics were the intended audience. The Hadley UK grid data is in netcdf format, a very well-established standard in the academic community. However, using it was quite challenging, despite starting with a good level of R knowledge. There was a surprising lack of good resources for help on how to pick out temperatures for a given geographical location, and date, using R. There’s definitely an opportunity for someone (maybe Hadley Centre / CEDA themselves) to signpost or create a simple exemplar or even a tutorial. The web pages were ambiguous about whether data could be extracted based on OS grid reference, as opposed to latitude and longitude. The provisional data being in a different format and website from the confirmed data added to the amount of time consumed trying to work with this data.
“The HadUK-Grid dataset is produced on a 1km x 1km grid resolution on the Ordnance Survey’s National Grid.” https://www.metoffice.gov.uk/research/climate/maps-and-data/data/haduk-grid/datasets
The above page has a link to an explanation of OS grid references, where the reader can learn how to find a UK grid reference “The quickest way to find a grid reference of a location is to go to the OS Maps desktop version and right click on the location – it’s that simple! You should see two letters followed by two sets of five numbers like this SZ 65750 98047. If you’re using the OS Maps app then you’ll need to press and hold to find the grid reference for that location.”
Whereas, the metadata present in both the annual and monthly files tells me there are variables for longitude and latitude, but there does not seem to be a variable corresponding to an OS UK grid reference as described in the links that were provided. So it is confusing. I did resort to Wikipedia - https://en.wikipedia.org/wiki/Ordnance_Survey_National_Grid . There’s no mention of UTM, or OS or British National Grid in the metadata that’s outputted by print.nc() - see “/open_data/Metadata_from_HadUK_annual_n_monthly_compared.docx.odt”. But on closer inspection, there are variables relating to transverse mercator, and false eastings and false northings, suggesting that if I use the latitude and longitude for my chosen location, I’m now not sure whether they will actually correspond to Edinburgh or somewhere closer to Manchester! I would suggest adding something in the global attributes and the dataset page to clarify.
P.S. found a line in the academic journal publication accompanying the dataset that is relevant: “DATA LOCATION, FORMATAND ACCESSIBILIT YVersion 1.0.0.0 of the HadUK‐Grid dataset is available forusers to download from the CEDA Archive (Met Office,2018). The grids are packaged as CF‐compliant (cfconventions.org) netCDF files (Unidata, 2019). The primary datasetis a 1 × 1 km grid on the British National Grid projection(EPSG:27700) Hollis et al 2019 So, will proceed on the basis that the offset is already applied. Might test this by trying to compare max and min values, and where they would cover ie Scilly Isles to Orkney.”
From the NorData tutorial: the dimensions tell you the size and shape of the data (don’t tell you what the values are; the values are in the variables). ie the HadUK files both annual and monthly have 900 X co-ordinate and 1,450 Y co-ordinate values. A variable can have multiple attributes etc. There is a useful definition of data variables and coordinate variables in the section on understanding netCDF files at https://nordatanet.github.io/NetCDF_in_R_from_beginner_to_pro/01_opening_and_understanding.html#importing-some-data-from-opendap .
Marsden, L. (2024, May 31). NetCDF in R - from beginner to pro. Zenodo. https://doi.org/10.5281/zenodo.11400754
Flood maps
We knew from the one-off survey we ran at Edinburgh Climate Festival 2023 that the public want to see flood maps showing past floods and future risk. We found ready-made maps on the SEPA website, but they are under strict intellectual property rules. Therefore, an approach was taken of generating a map, and reporting in writing on the patterns it showed, rather than sharing the map. Similarly, it is not possible to share a video tutorial on using the SEPA flood maps, as to do so might infringe copyright. So here is a simple set of steps to follow, to view flood risk:
Click Start Now, and then read and accept the terms and conditions
Zoom in, to the Edinburgh area (or wherever you want to examine)
Use the layers button (‘Map Content’) to select either River Flooding risk, Coastal Flooding or Surface Water and Small Watercourses Flooding. Choosing just one of the three makes the map reasonably clear to read.
- In each of the three flooding types listed above, you can select high, medium and low likelihood - we suggest just picking high and medium.
![]()
Click ‘Map Key’ to display the map legend.

Map Key icon If the legend is empty, and the map is not showing any colour highlighting, you may need to zoom in closer, and wait a couple of seconds for the colour highlighting to be added. Note that when you grab and drag the map to pan to a different area, at first the area does not show the highlighting - you need to release the drag and wait for a couple of seconds for it to refresh.
Contributions
D4CAE is grateful to the following people for sharing ideas and signposting data sources that contributed to this report:
ECCAN - Edinburgh Communities Climate Action Network; Bruce Whyte; Isabella Tortora Brayda di Belvedere.
Thanks go to Izi Robe of the Climate Springboard team at the Edinburgh Climate Change Institute for the excellent training and support.
Pauline Ward generated the data visualisations using online tools and coding in R and Excel. Pauline has also written the copy. Yes, I do feel a bit funny writing about myself in the third person. It is hoped a greater number of the group’s existing and new volunteers will be involved more directly in producing future editions.
Data Sources
SAQD - Scottish Air Quality Database, Scottish Government https://www.scottishairquality.scot/
OpenAir data analysis tools, provided alongside Scottish Air Quality data, Scottish Government https://www.scottishairquality.scot/data/openair
UK NAEI - National Atmospheric Emissions Inventory https://naei.beis.gov.uk/
The Met Office Local Authority Climate Explore tool allows the user to easily generate a very detailed, well-presented, snappy report about their chosen local authority. I sent feedback explaining that licensing restrictions were a limit on the usefulness of the output, since we would want to share the content, to raise awareness.